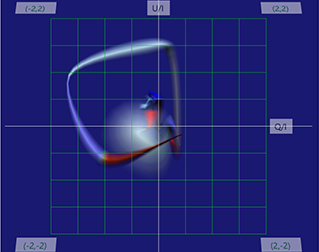
Optical polarization provides important clues to the magnetic field in blazar jets. It is easy to find noteworthy patterns in the time-series data of the polarization degree (PD) and position angle (PA). On the other hand, we need to see the trajectory of the object in the Stokes QU plane when the object has multiple polarized components. In this case, ironically, the more data we have, the more difficult it is to gain any knowledge from it. Here, we introduce TimeTubes, a new visualization scheme to explore the time-series data of polarization observed in blazars. In TimeTubes, the data is represented by tubes in 3D (Q, U, and time) space. The measurement errors of Q and U, color, and total flux of objects are expressed as the size, color, and brightness of the tubes. As a result, TimeTubes allows us to see the behavior of six variables in one view. We used TimeTubes for our data taken by the Kanata telescope between 2008 and 2014. We found that this tool facilitates the recognition of the patterns in blazar variations; for example, favored PA of flares and PA rotations associated with a series of flares.


0 Comments