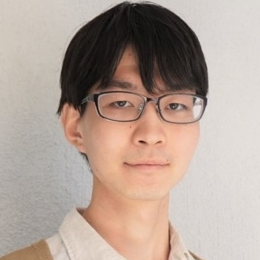
Invited Speakers
Jun Tao, Sun Yat-sen University, China (SciVis)
Title: Interactive Exploration of Flow Data
Abstract:
The scale and complexity of flow data have been growing over the last decades. This renders the traditional flow visualization limited, as it require an overwheming amount of information to be presented in the screen with limited 2D space. To tackle this challenge, interactive exploration techniques allow users to specify the structures of interest for visualization and reduce the visual complexity. In this talk, we will discuss the research in interactive flow visualization using two of our recent work as examples. Our discussion will focus on two aspects: how the abstract space may help to observe and interact with the complicated flow structures, and how the emerging interaction techniques can be applied to the flow visualization.
Biography:
 Jun Tao is an associate professor of computer science at Sun Yat-sen University and National Supercomputer Center in Guangzhou. Prior to this, he was an postdoctoral researcher at University of Notre Dame. He received a PhD degree in computer science from Michigan Technological University in 2015. His major research interest is scientific visualization, especially on applying information theory, optimization, and deep learning techniques to flow visualization and multivariate data exploration. More information can be found at http://juntao.org.
Naoko Sawada, Mitsubishi Electric Corporation, Japan (SciVis)
Title: Clustering-driven Visual Analytics for Universalities in Multi-Dimensional Time-Dependent Datasets
Abstract:
The identification of universalities in subsequences is one of the challenging tasks in time-series analysis. In this talk, I will present a multi-dimensional time-series subsequence clustering method and a visual analytics framework for the clustering results in terms of optical photo-polarimetric and near-infrared observation datasets of blazars. The clustering method challenges the issues of multi-dimensional time-series subsequence clustering, such as the cluster prototype definition, the similarity measurement between subsequences, the way to obtain less-overlapping subsequences, and the like. Various federated views allow users to scrutinize the clustering result. A case study for an actual blazar dataset by a domain expert demonstrates how effectively the method enhances users’ insights into datasets.
Biography:
 Naoko Sawada received the BE, ME, PhD degrees in information and computer science from Keio University, Japan, in 2017, 2018, and 2021 respectively. She is working for the Information Technology R&D Center, Mitsubishi Electronic. She stayed at Harvard University, Cambridge, Massachusetts as a visiting scholar in the Visual Computing Group from 2018 to 2020. Her main research interests are time-varying multi-dimensional data visualization and analytics.
Chenhui Li, East China Normal University, China (VA)
Title: Real-time Visual Query of Spatiotemporal Data Distribution via Density Dictionary Learning
Abstract:
Visual query of spatiotemporal data is becoming an increasingly important function in visual analytics applications. Various works have been presented for querying large spatiotemporal data in real time. However, the real-time query of spatiotemporal data distribution is still an open challenge. As spatiotemporal data become larger, methods of aggregation, storage and querying become critical. In this talk, we introduce a new visual query system that creates a low-memory storage component and provides real-time visual interactions of spatiotemporal data.
Biography:
 Dr. Chenhui Li is an associate professor of the School of Computer Science and Technology at East China Normal University. He works on the research of visual analysis and spatiotemporal data mining. He received Ph.D. from the Department of Computing at The Hong Kong Polytechnic University, advised by Prof. George Baciu. He received ICCI*CC Best Paper Award (2015), SIGGRAPH Asia Sym. Vis. Best Paper Award (2017), and Shanghai Science and Technology Progress Award (2020). He serves as the program committee member for ChinaVis, CAD&CG, and VINCI. He also serves as the reviewer for several conferences and journals including IEEE TVCG, IEEE VIS, ACM CHI, EuroGraphics, et al.
Rei Takami, Yahoo, Japan (InfoVis)
Title: Visual Analytics for the Formulation of Evaluation Metrics for Multi-dimensional Time-series Data
Abstract:
In many domains, such as medical and sports, the importance of multi-dimensional time-series data is increasing. To quantitatively evaluate current situations and the quality of those data, evaluation metrics (e.g., KPIs) are expected to play an important role. However, it is difficult for domain experts to formulate metrics, especially for data with high dimensionality and temporal characteristics. I will explain a visual analytics interface to support those tasks in a human-in-the-loop manner.
Biography:
 Rei Takami received the M.S. degree from Tokyo Metropolitan University, in 2020. His main research interests included information visualization and visual analysis of time series data. He is currently working as a Software Engineer at Yahoo Japan Corporation, Tokyo, developing an analytics platform for news media and tools to assist editors’ workflows.
Juanjuan Long, Jiangnan University, China (Art)
Title: Data-driven Interactive Narrative Visualization
Abstract:
Data-driven interactive narrative visualization differs in important ways from traditional forms of storytelling. In this talk, from the perspective of a designer, will share relevant cases and understanding of narrative visualization. The aim is to get a closer look at process of transforming data into visual stories.
Biography:
 Juanjuan Long is an associate professor in digital media department of design School at Jiangnan University. She is mainly engaged in the research of data information visualization, graphic design, and digital media interaction design. Her information design work was published in Data Flow by Gestalten Publishing House. Her design and guidance works were selected by IEEE VIS 2021 Arts Program exhibition and shortlisted by IEEE PacificVis Visual Data Storytelling three times.
Hiroaki Natsukawa, Osaka Seikei Univerisity/Kyoto University, Japan (VA)
Title: Ecosystem Dynamics Revealed by Combining Data-Driven Analysis and Visualization Techniques
Abstract:
Understanding and predicting ecosystem dynamics is a major research challenge in promoting ecosystem conservation and sustainable use, as stated in the Sustainable Development Goals (SDGs). In this talk, I will introduce Empirical Dynamic Modeling (EDM), a data-driven analysis method for understanding the dynamics of complex ecosystems, and an analysis approach that combines EDM and interactive visualization techniques. Particularly, I will introduce the examples of applications to ecological data.
Biography:
 Hiroaki Natsukawa is a junior associate professor / senior lecturer in Academic Center for Computing and Media Studies, Kyoto University. He received a Ph.D. in engineering from Kyoto University in 2013. Although formally trained as a researcher in the field of biomedical engineering at Kyoto University, He has successfully crossed fields into other areas such as information visualization, neuroscience, and more recently into nonlinear dynamics. Currently, he has worked in the field of information visualization and his work focuses on developing visual analytics systems enabling data-driven analytical reasoning by empirical dynamic modeling in collaboration with UC San Diego. He is currently an associate editor of Journal of Visualization, was a The 36th Annual Meeting of Japan Biomagnetism and Bioelectromagnetic Society Local Committee, IEEE PacificVis 2019, 2022 Poster Co-chairs, IEEE PacificVis 2018 Publication Chair, The 47th Symposium of Visualization Society of Japan Organizer, NICOGRAPH International 2017 Local Committee Chair, JSST2016 Publication Chair, JHBM18 Local Committee.
