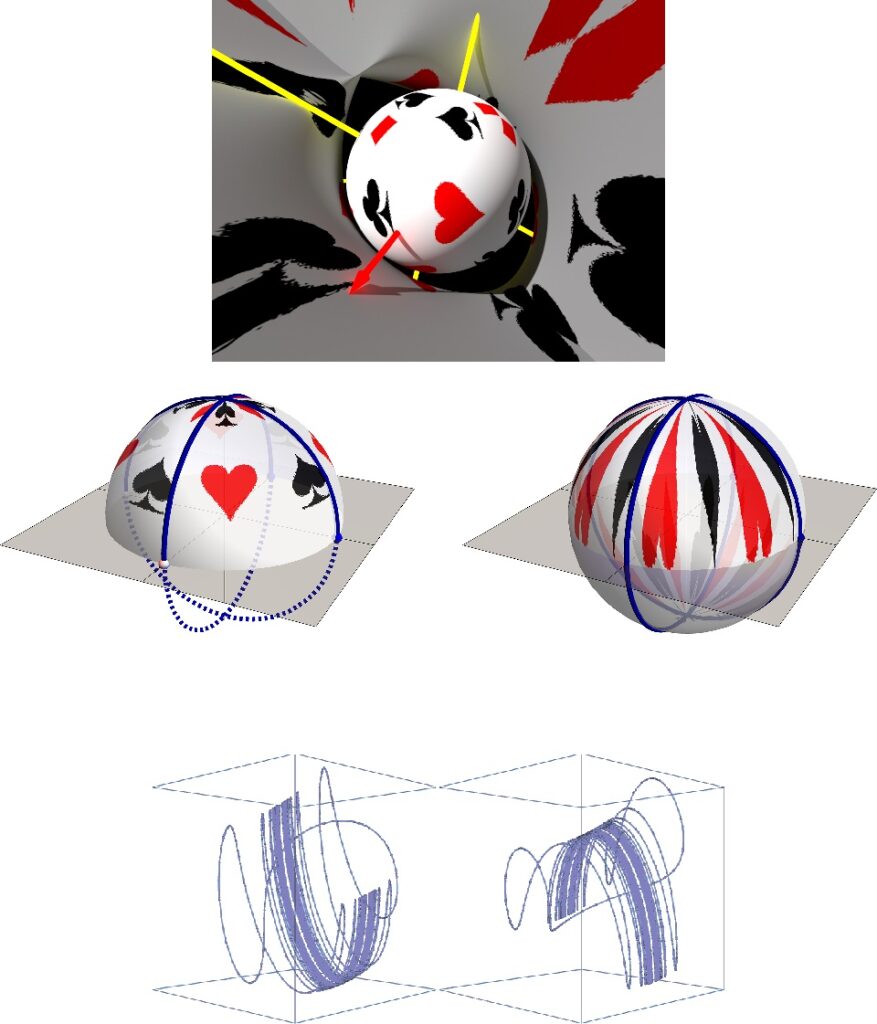
To visualize the behavior of complex functions, we need four dimensions. We raise the question that has been neglected: “What does the Riemann sphere’s axis stand for?” The answer can be obtained by setting the immersive environment at the sphere’s origin, which is always undefined in projective geometry. By using our immersive math environment, we visually confirmed that a continuous mapping exists between a complex projective line (i.e., a complexified circle) and the Riemann sphere; therefore, we can call them homeomorphic. Such a visualization idiom seems to be applicable to other learning themes, and it also helps us more easily visualize even higher-dimensional math objects.
By using the same method that we used to construct a real projective line with the equation RP^1 = R^1 ⋃ R^0, we can then create a new, fourth form of the projective plane (the first form is often referred to as a cross-cap, the second as a “Boy’s surface,” and the third as a “Roman surface”), according to the equation RP^2 = R^2 ⋃ RP^1, as shown in the above figure. This new form looks almost like a normal spherical surface, except that an infinite number of self-intersections occur at both poles of the sphere.Therefore, we can draw some elementary math functions that we are familiar with on this new projective plane. The figure shown below illustrates an example of visualizing y = cos x and y = cos 1/x. Note that both are drawn in the same shape as a whole only by differences in whether they are oscillating at infinity or oscillating at the origin.


0件のコメント