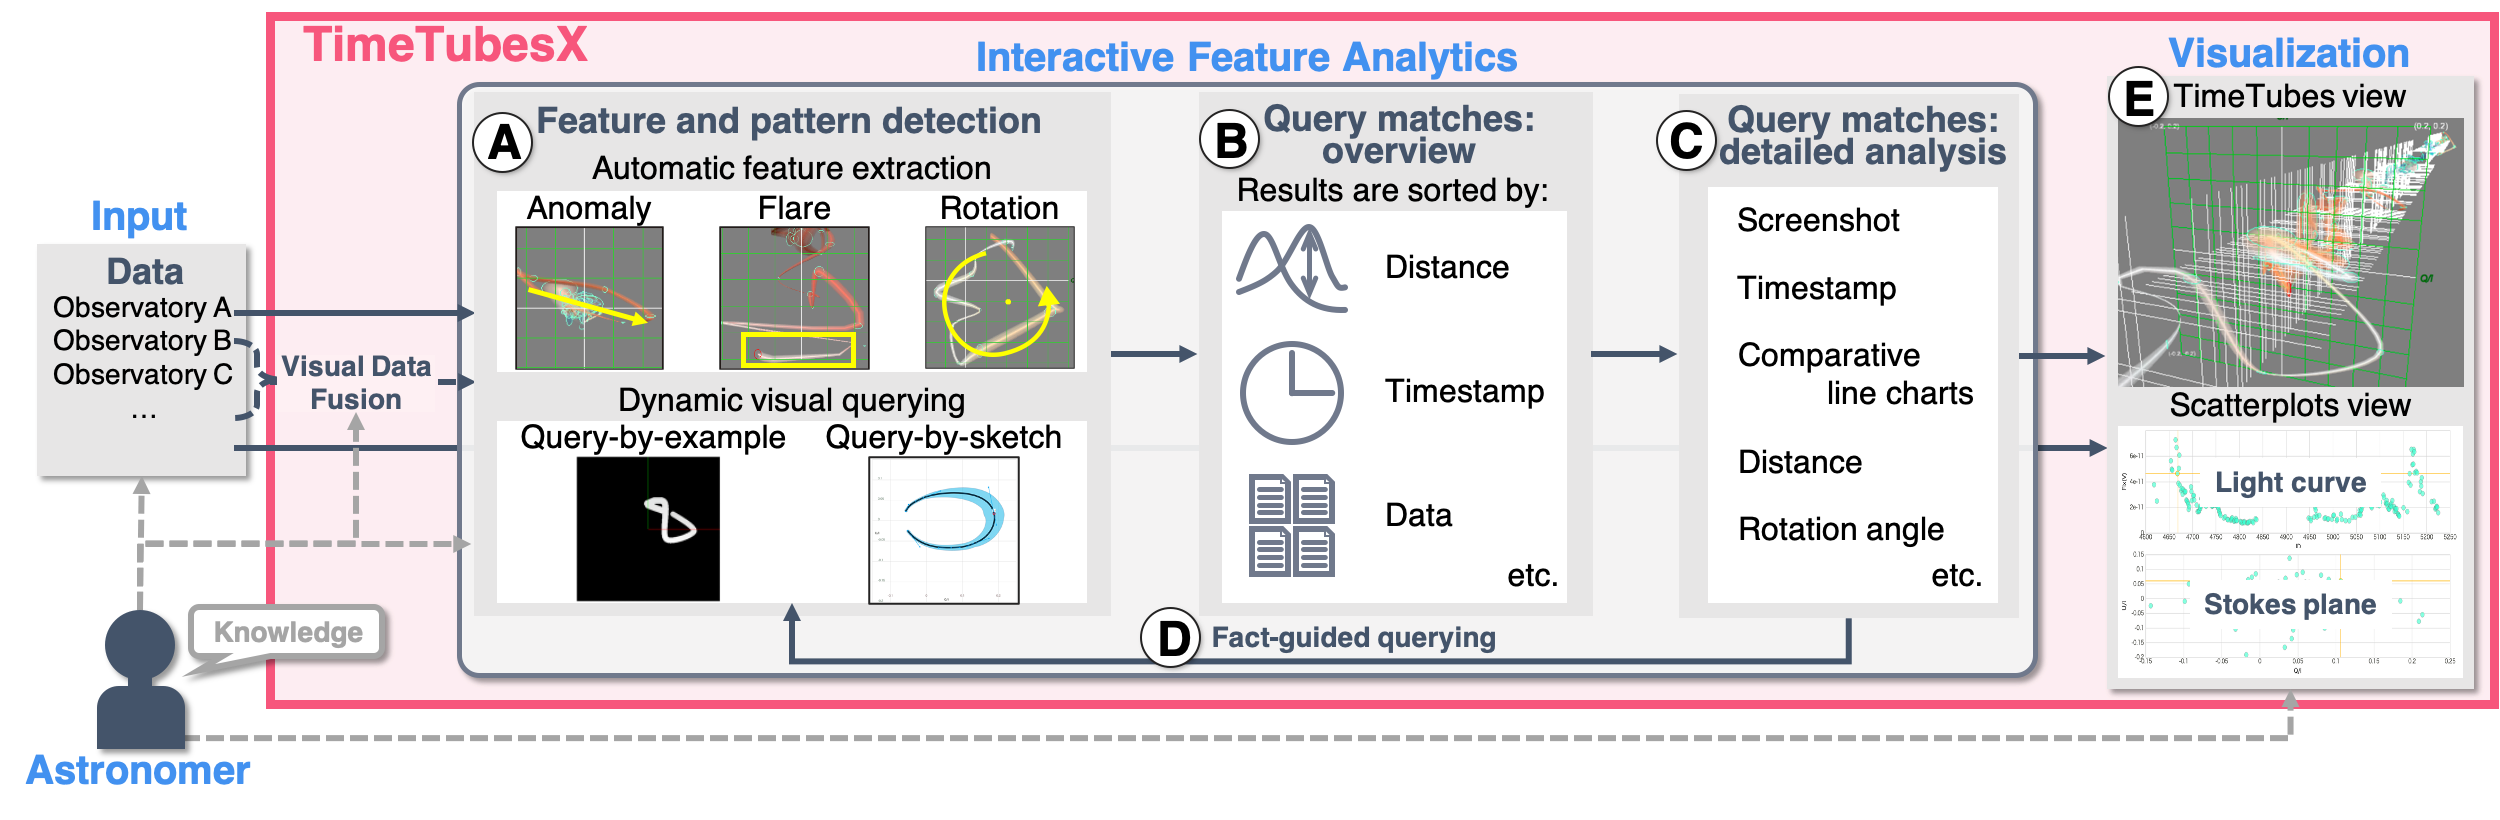
Blazars are celestial bodies of high interest to astronomers. In particular, through the analysis of photometric and polarimetric observations of blazars, astronomers aim to understand the physics of the blazar’s relativistic jet. However, it is challenging to recognize correlations and time variations of the observed polarization, intensity, and color of the emitted light. In our prior study, we proposed TimeTubes to visualize a blazar dataset as a 3D volumetric tube. In this paper, we build primarily on the TimeTubes representation of blazar datasets to present a new visual analytics environment named TimeTubesX, into which we have integrated sophisticated feature and pattern detection techniques for effective location of observable and recurring time variation patterns in long-term, multi-dimensional datasets. Automatic feature extraction detects time intervals corresponding to well-known blazar behaviors. Dynamic visual querying allows users to search long-term observations for time intervals similar to a time interval of interest (query-by-example) or a sketch of temporal patterns (query-by-sketch). Users are also allowed to build up another visual query guided by the time interval of interest found in the previous process and refine the results. We demonstrate how TimeTubesX has been used successfully by domain experts for the detailed analysis of blazar datasets and report on the results.
0件のコメント