 “Visualization” has been playing an important role for humans to intuitively understand and express information long before the birth of computers. Since the invention of Ivan Sutherland’s sketchpad in the 1960s, humans have gained the power to draw pictures on a computer and interactively manipulate the virtual space. The technology has been applied to and has given new possibilities to visualization. Visualization using computers started with drawing numerical data with logical structures. Then it became able to visualize big data and complex data without logical structure, and now even interactive human-centered analysis is possible. Visualization using computers has been expanding the humans’ capability of analysis.
Visualization is a bridge between data and humans. It is absolutely indispensable in today’s highly developed information society in which we aim to create a better society with data. At the dawn of visualization, it was only for a limited number of scientists and experts but now it is applied to almost all fields and industries imaginable. Moreover, it is never rare that normal people use visualization on a daily basis. In such a world, Fujishiro Lab is pioneering the forefront of how humans and data are involved in very interesting areas.
Members
Research themes

![]()
aflak:Visual Programming Environment for Visual Analysis of Integral Field Spectroscopy
![]()
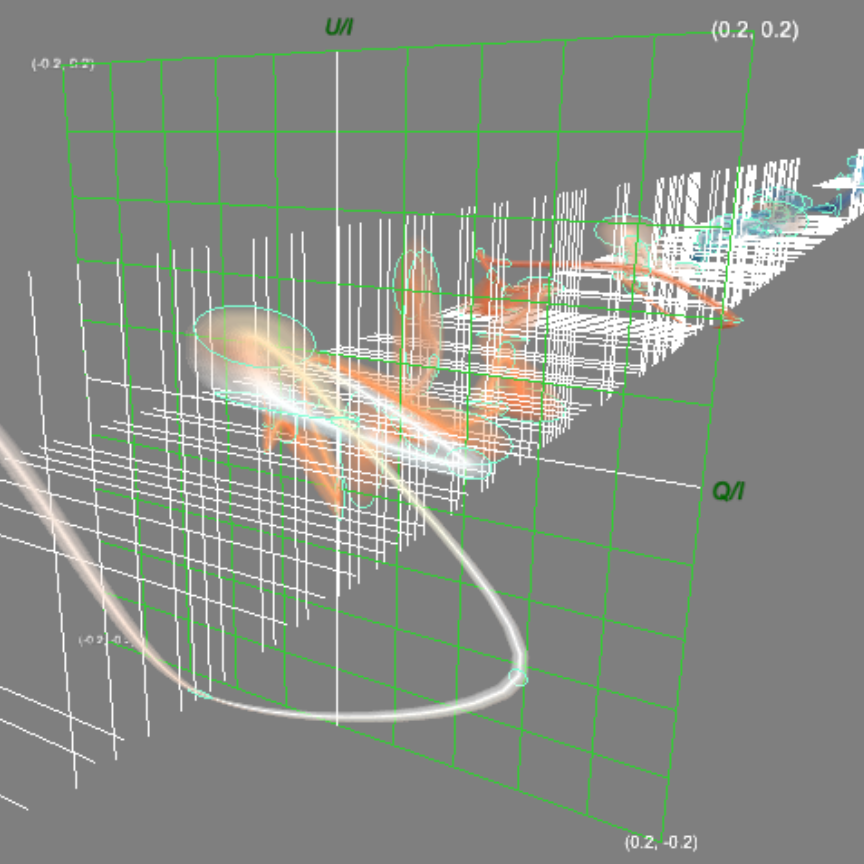
Visual Analytics for Multi-dimensional Time-dependent Observed Datasets of Blazars
![]()
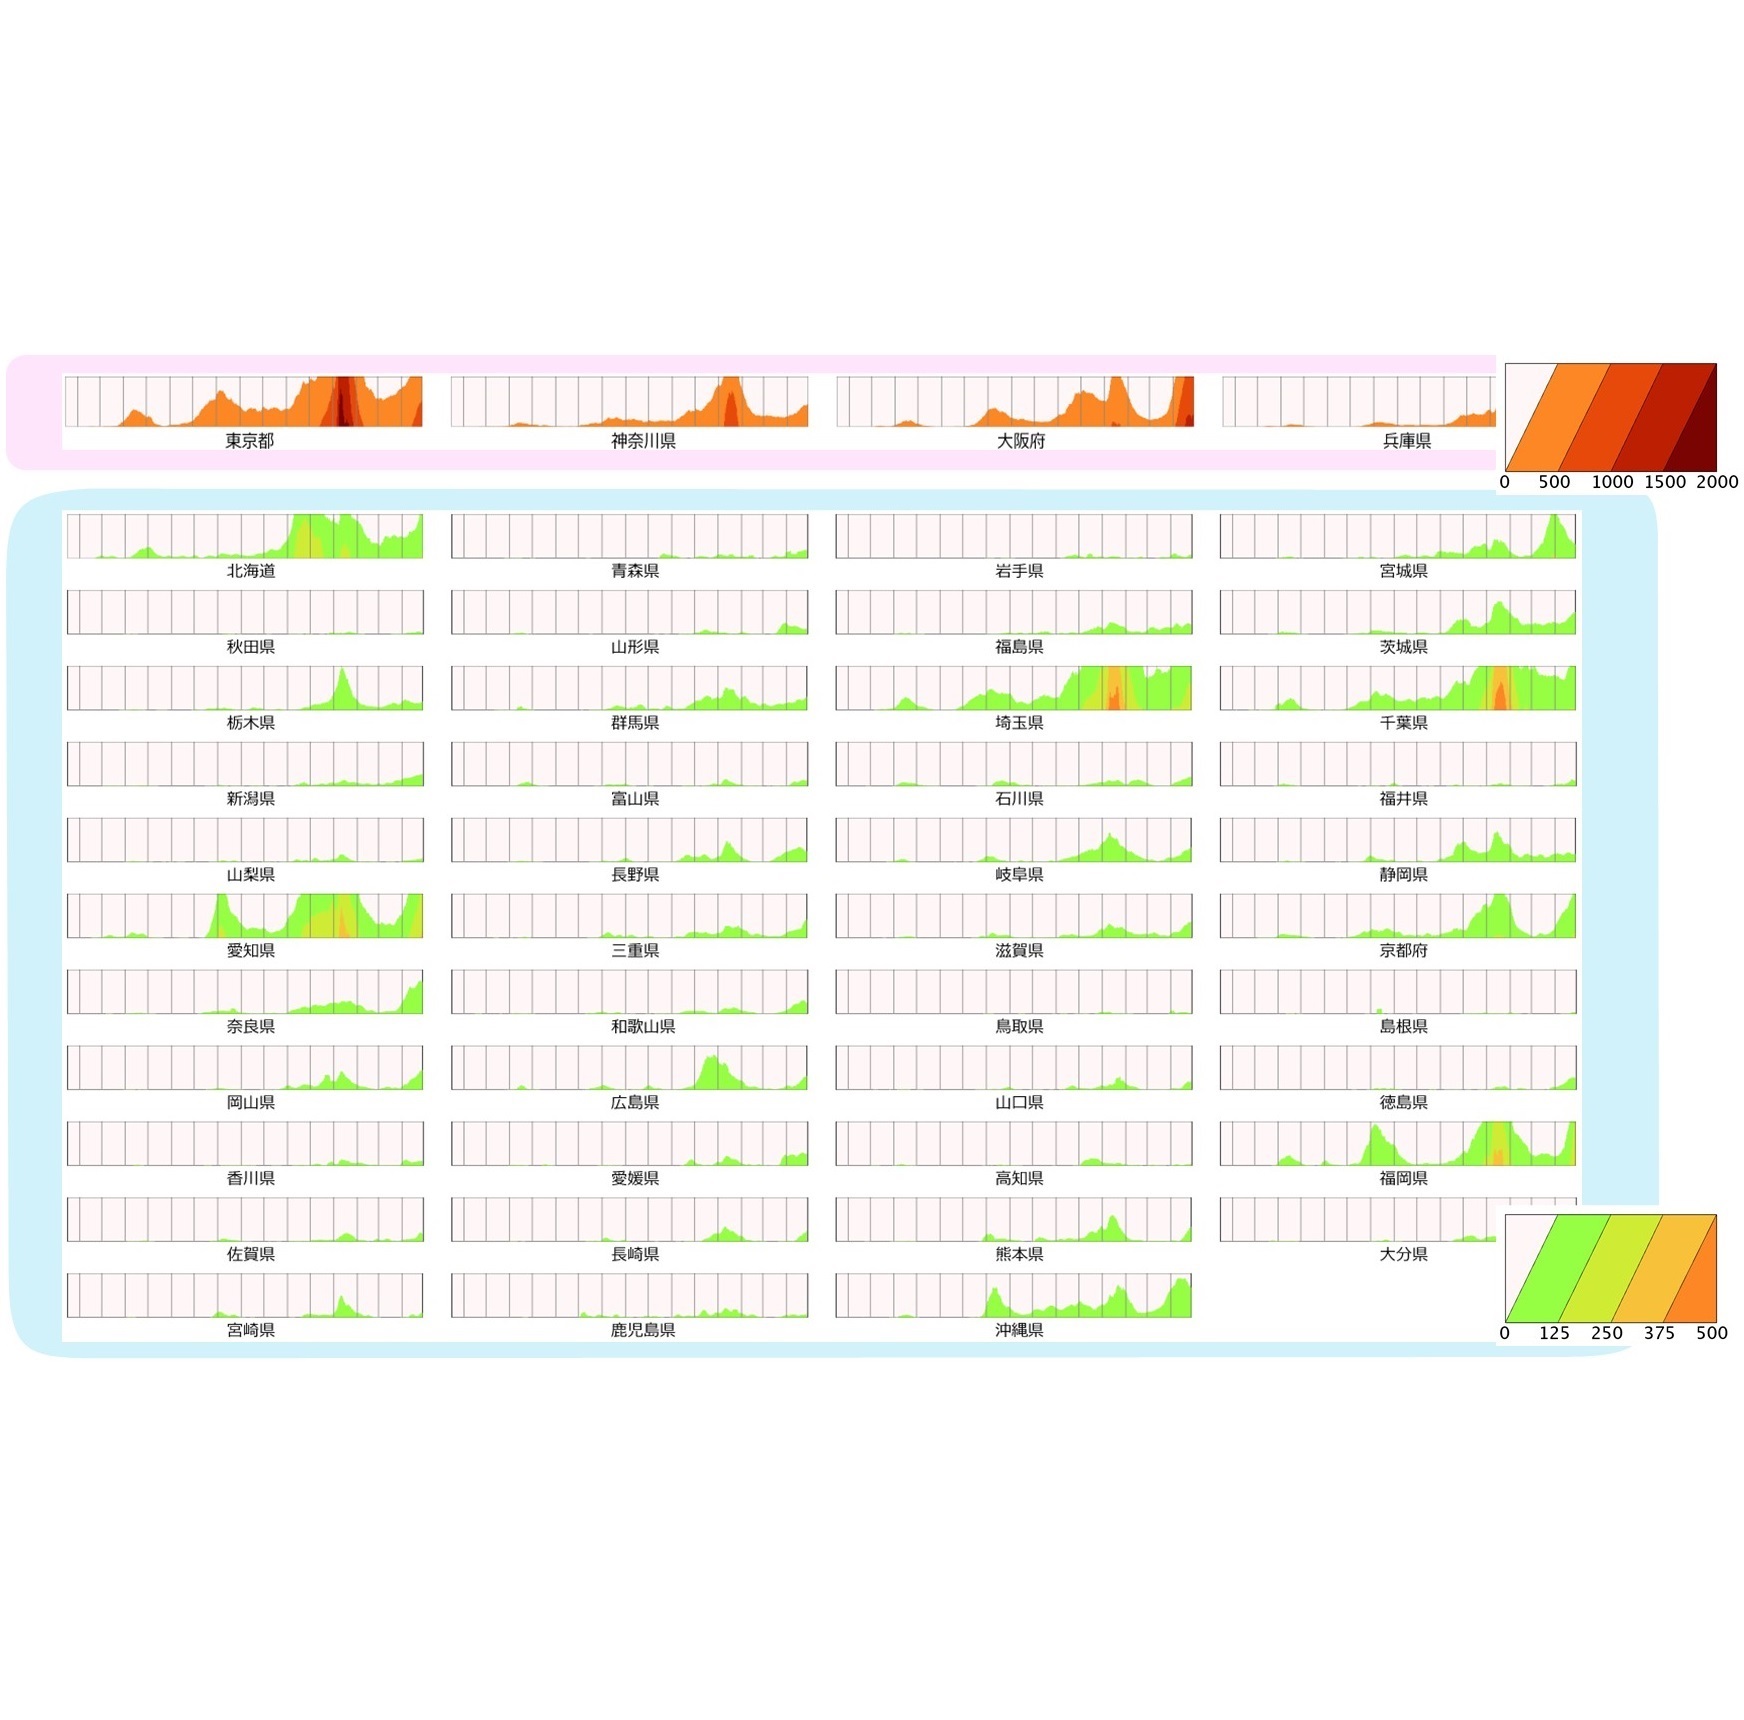
Visualizing COVID-19 Infection Data with Twotone Pseudo Color-coded Sparklines
![]()
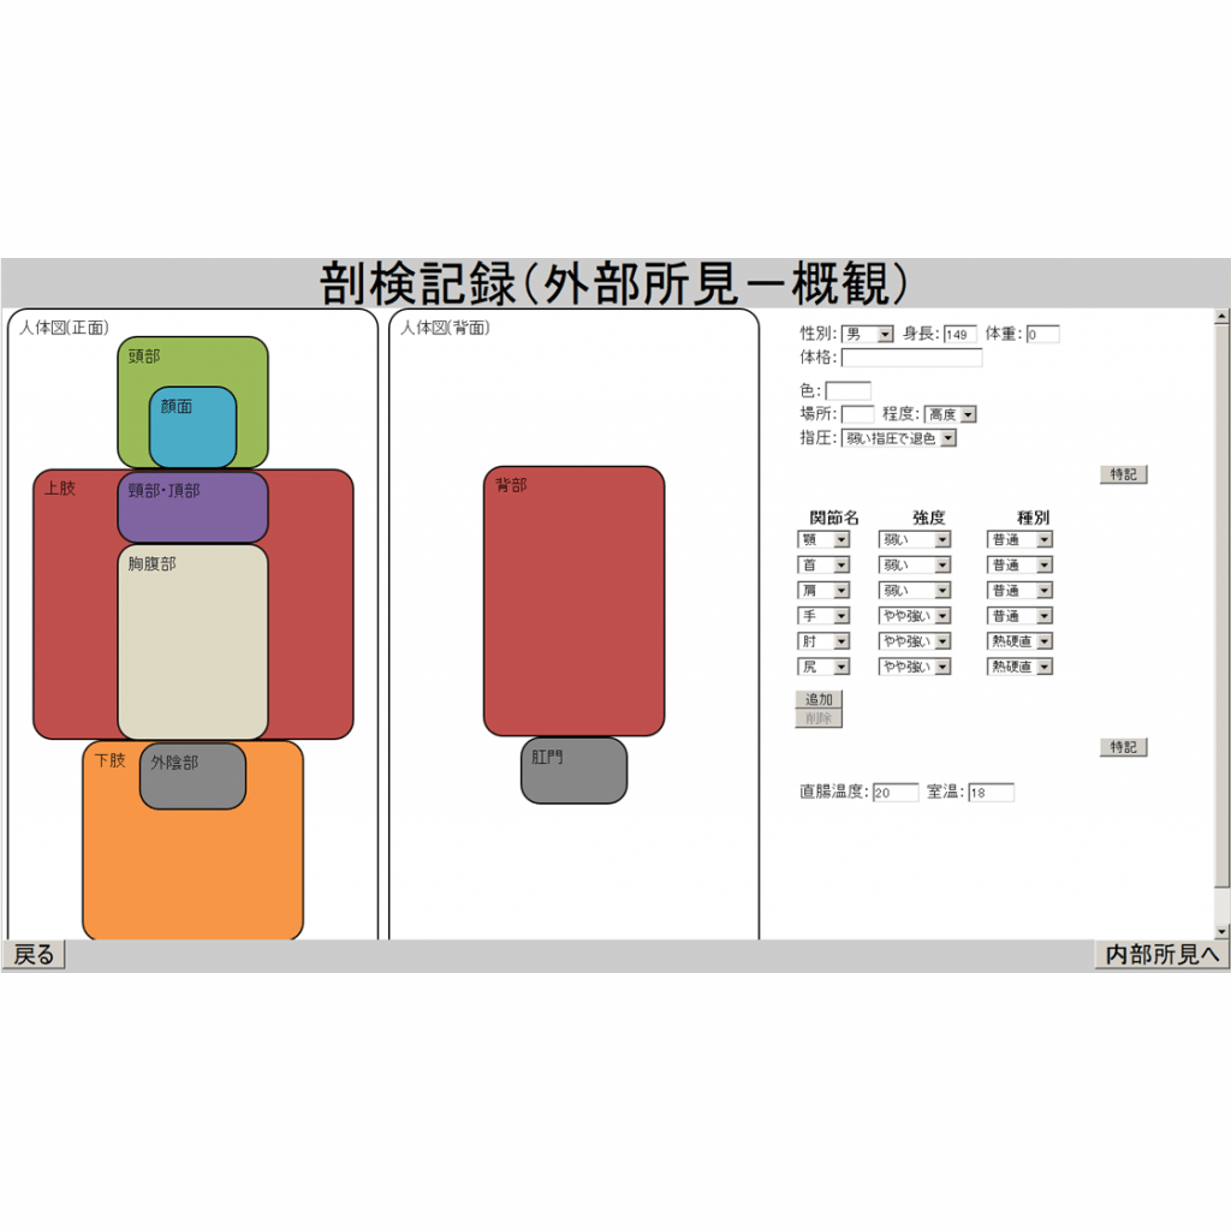
Developing an Environment of Visual Analysis for Forensics Using LMML Which Is a Markup Language Dedicated to Forensic Data

