Summary
The ABC (Asymmetric Bi-Clustering) tool had been developed in the planned research project entitled “Consolidation of Visualization Platform Toward Facilitating Sparse Modeling” of the MEXT Grant-in-Aid for Scientific Research on Innovative Areas (FY 20134-2018): “Initiative for High-Dimensional Data-Driven Science Through Deepening of Sparse Modeling”.
It is presently expected to discover useful information embedded in a large volume of high-dimensional datasets to be generated from routine observations in a variety of disciplines. Sparse modeling builds on the sparseness assumption of high-dimensional space to efficiently extract important latent features even from exponentially exploded datasets. The results, however, may only be represented by dozens of dimensions. The ABC is a novel information visualization tool that can reduce the dimensionality of the physical problems further to 2-, 3-, or 4-dimensional representations in the designated information space [IC-4]. The next diagram schematically shows an extended sparse modeling framework for interactive visual analysis of high-dimensional datasets, where the ABC tool explicitly incorporates visual feedbacks from the analysts, to establish a human-in-the-loop [J-1].
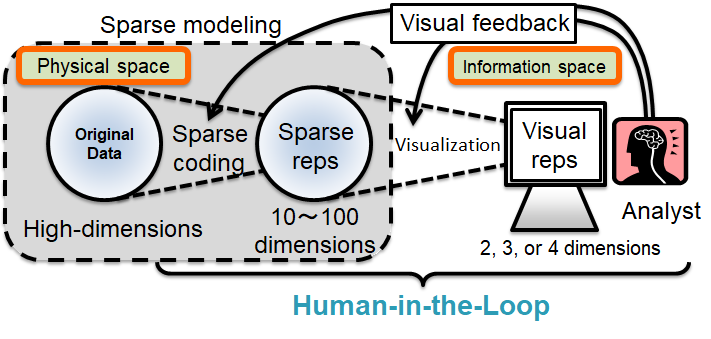
As an initial achievement in this project was an axis-contractible parallel coordinate plots (PCPs) using spectral graph analysis [J-2, IC-5]. This tool allows us to progressively select latent variables from a moderately high-dimensional dataset, whereas the resulting data still comprises all of the original data samples, and thus leaves a difficulty to locate a subspace of interest embedded in the original dataset both in terms of data dimensions and data samples. The issue was substantially addressed by revisiting the concept of bi-clustering, which was proposed by J. A. Hartigan in 1972, and since then it has been extensively used in various fields, such as genomic analysis and document clustering. Note here that the prefix “asymmetric” stems from the feature to differentiate the ABC tool from the conventional bi-clustering that different similarity metrics are adopted for the analysis of data dimensions and data samples.
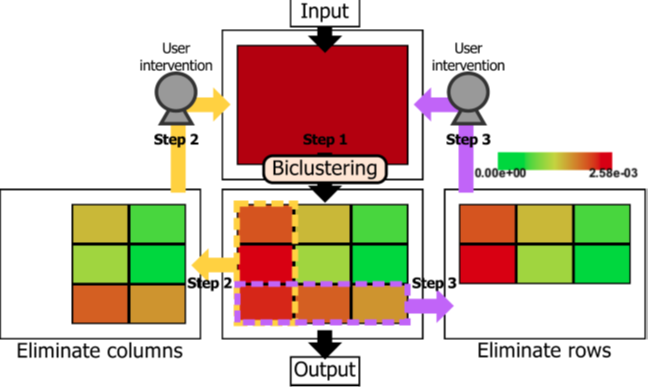
As shown in the next diagram, the main processing flow of the ABC tool consists of subspace clustering and subspace search. At Step 1, simultaneous clustering of highly correlated data dimensions and data samples is automatically performed. Colored block matric diagram is used to visualize the data coherence within each block (green: green―high: red). The analyst refers to this diagram to interactively eliminate incoherent dimensions and outliner samples at Step 2 and Step 3, respectively. Systematic visual analysis is supported because all the process of such an intentional exploration of high-coherent subspace is managed by its history tree.
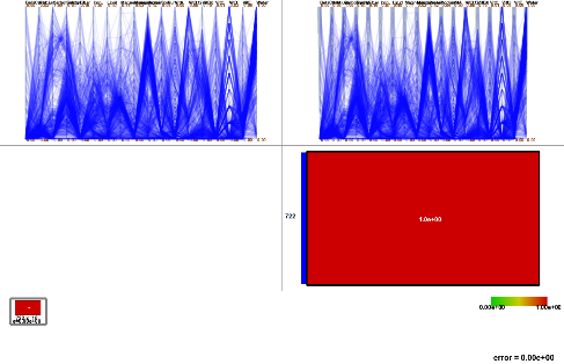
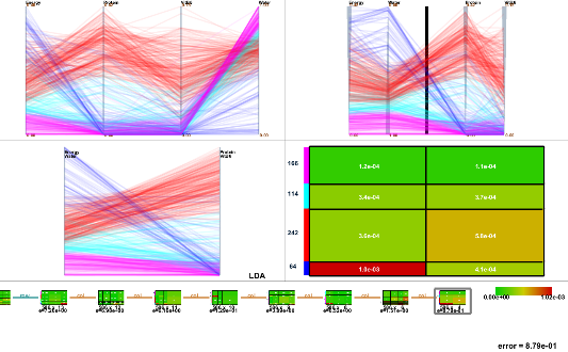
As a test case, the ABC tool was applied to the analysis of the USDA Food Composition dataset. As shown in Figures (a) and (b), the system interface consists of six components: Classical PCP (top left); clustered PCP (top right); contracted PCP (middle left) and its corresponding colored block matrix diagram (middle right); history tree (bottom left); and object function value (bottom right).
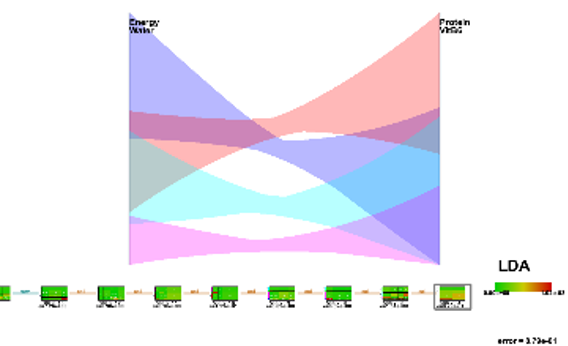
We started with the initial state in Figure (a), and as a consequence of bi-clustering whose initial estimates for clusters and data samples are both 9, we obtained the contraction result with 2 dimensions-by-4 clusters in Figure (b), where the left axis shows the high coherence between Energy and Water, while the left axis the high coherence between Protein and Vitamin B6. Figure (c) employs strip rendering to comprehensibly visualize the contracted PCP in Figure (b).
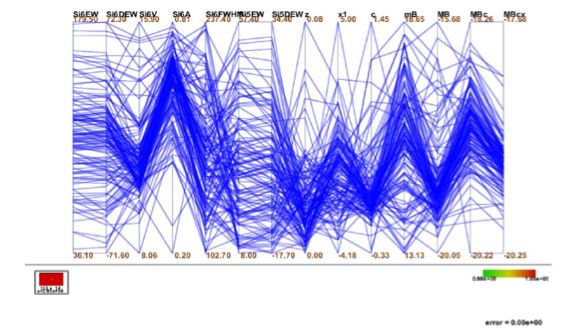
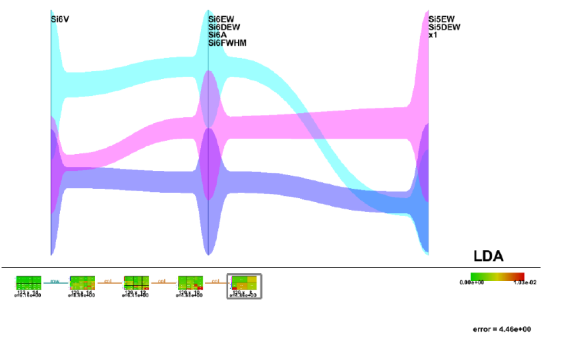
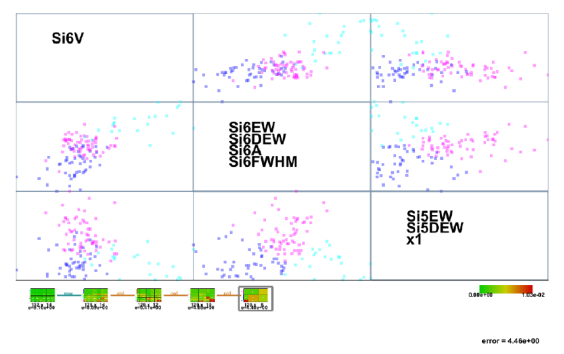
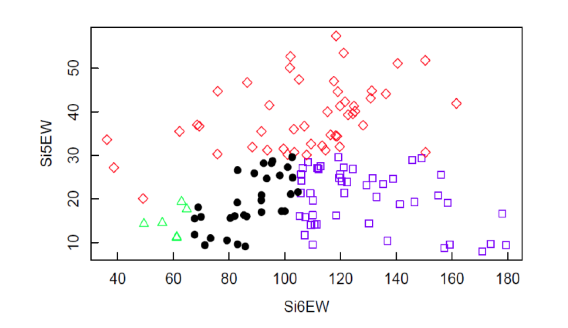
Then, the ABC tool was applied to another problem that classifies Ia-type supernovae [IC-2].Classification of observation samples leads to precise estimation of the distance to the supernovae, while identifying latent variables contributes to deeper understanding of their explosion mechanisms. The target is the shared dataset (14 dimensions, 132 samples) managed at UC Berkeley. We started with the initial state in Figure (a) and reached a clustering of 129 samples in 3 dimensions in Figure (b). It is known that Ia-type supernovae can be bisected into normal group and highspeed expansion group in terms of silicon absorption line and intensity & gas expansion rate. When transforming the result in Figure (b) to a scatterplot matrix in Figure (c), we realized that the clustering coincides fairly with the traditional clustering results reported in Branch+2006 in Figure (d). The intensity is well-known as an important index for the distance to the celestial body. Indeed, it has a weak correlation with silicon absorption line and intensity & gas expansion rate, but its high deviation suggests the existence of other hidden physical determinants.
A big issue with the ABC tool is how to determine the initial numbers of dimension and sample clusters for guaranteeing an effective converge to reliable data clustering. Assuming a constrained von Mises-Fisher distribution, we developed a stochastic ABC tool that builds on Bayes’ inference to estimate proper initial numbers of dimension and sample clusters [IC-3]. Toward effective understanding the features of the target multi-dimensional dataset, analysts used to alternately compare the data variables, and once they have found a specific subset of mutually coherent variables, they try to continue their further exploration within the subset. However, PCPs has an inherently limited capability to allow the user to visually explore the data coherence between a pair of distantly plotted axes. Therefore, utilization of federated views with many-to-many PCPs and one-to-many PCPs were also proposed in [IC-1].
Members
| Name | Affiliation | Web site |
|---|---|---|
| Shigeo Takahashi | The University of Aizu | Personal website |
| Kazuho Watanabe | Toyohashi University of Technology | Lab website |
| Hsiang-Yun Wu | TU Wien | Personal website |
| Makoto Uemura | Hiroshima University | Personal website |
| Yusuke Niibe | Keio University |
Video
Publications
Journals
- Issei Fujishiro, Shigeo Takahashi, Kazuho Watanabe, Hsiang-Yun Wu: “Sparse modeling and information visualization” (in Japanese),Journal of IEICE, Vol. 99, No. 5, pp. 466–470 (2016).
- Koto Nohno, Hsiang-Yun Wu, Kazuho Watanabe, Shigeo Takahashi, Issei Fujishiro: “Axis contraction of parallel coordinates using spectral graph analysis” (in Japanese),Journal of IIEEJ, Vol. 44, No. 3, pp. 447–456 (2015).
Conferences/Symposiums
International conferences/symposiums
- Hsiang-Yun Wu, Yusuke Niibe, Kazuho Watanabe, Shigeo Takahashi, Makoto Uemura, Issei Fujishiro: “Making many-to-many parallel coordinate plots scalable by asymmetric biclustering” (VisNotes), in Proceedings of IEEE Pacific Visualization Symposium 2017, pp. 305–309, Seoul (2017) [doi: 10.1109/PACIFICVIS.2017.8031609].
- Makoto Uemura, Koji S. Kawabata, Shiro Ikeda, Keiichi Maeda, Hsiang-Yun Wu, Kazuho Watanabe, Sheigeo Takahashi, Issei Fujishiro: “Data-driven approach to Type Ia supernovae: Variable selection on the peak luminosity and clustering in visual analytics,” Journal of Physics: Conference Series (HD3-2015 ), Vol. 699, Article No. 012009 (2016) [doi: 10.1088/1742-6596/699/1/012009].
- Kazuho Watanabe, Hsiang-Yun Wu, Shigeo Takahashi, Issei Fujishiro: “Asymmetric biclustering with constrained von Mises-Fisher models,” Journal of Physics: Conference Series (HD3-2015 ), Vol. 699, No. 012018 (2016) [doi: 10.1088/1742-6596/699/1/012018].
- Kazuho Watanabe, Hsiang-Yun Wu, Yusuke Niibe, Sheigeo Takahashi, Issei Fujishiro: “Biclustering multivariate data for correlated subspace mining,” in Proceedings of IEEE Pacific Visualization Symposium 2015, pp. 287–294, Hangzhou (2015) [doi: 10.1109/PACIFICVIS.2015.7156389].
- Koto Nohno, Hsiang-Yun Wu, Kazuho Watanabe, Shigeo Takahashi, Issei Fujishiro: “Spectral-based contractible parallel coordinates,” in Proceedings of iV2014, pp. 7–12, Paris (2014) [doi: 10.1109/IV.2014.60].
Grants
 Grant-in-Aid for Scientific Research on Innovative Areas: 25120014(2013―2017)